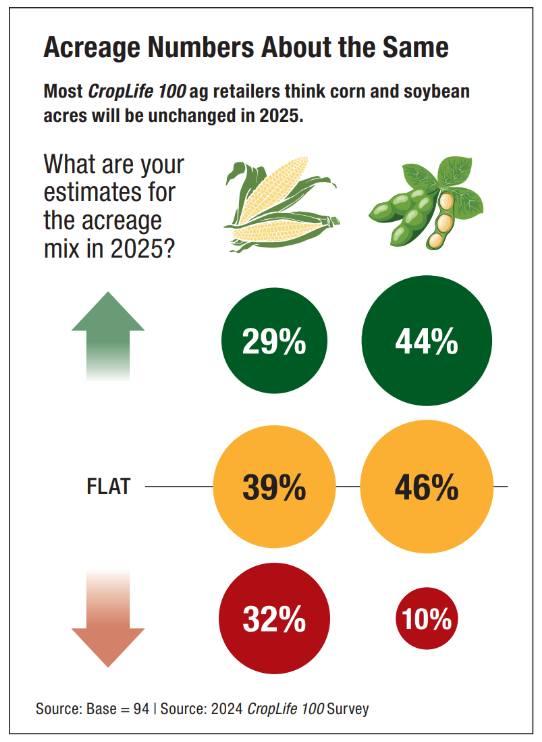
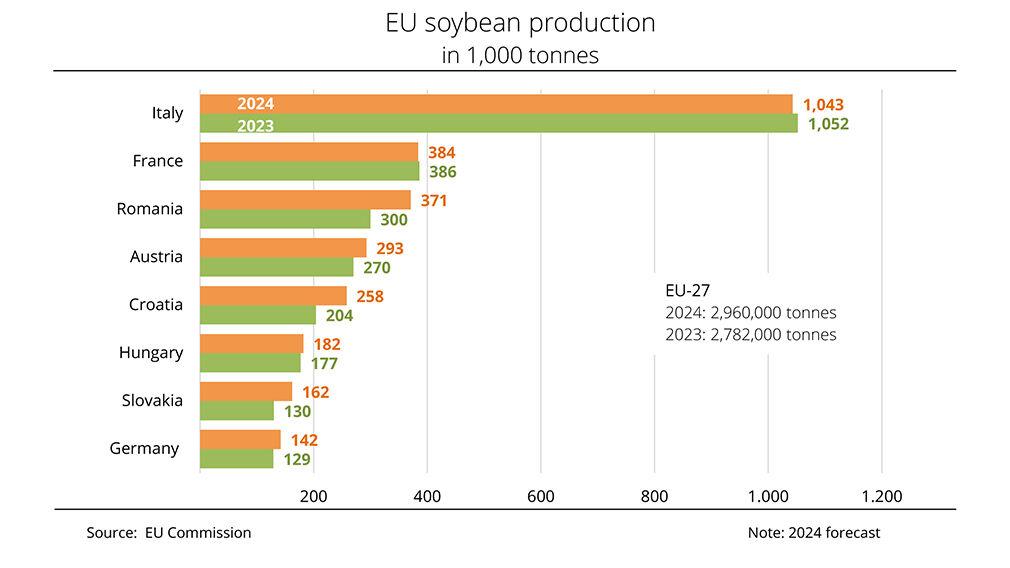
Shifts in cropping intentions across the United States are unsettling assumptions that often guide the spring planting season. Where corn ends and soybeans begin has always been a crucial aspect of American agriculture, but in 2025, the dividing line appears to be shifting yet again. Not for the first time—yet with slightly sharper contours than most anticipated.
Latest USDA reports reveal that U.S. corn acreage is set to leap notably this season. Farmers intend to dedicate approximately 95.3 million acres to corn, which marks a striking 5% rise over last year’s plantings. This figure surpasses pre-report estimates and brings new weight to questions surrounding crop balance and future pricing prospects.
Contrast emerges when observing soybean acreage trends. The anticipated soybean area drops by about 4%, settling at around 83.5 million acres. Such a swift decline reflects broader economic undercurrents: prices, input costs, international demand whiplash—all acting as forces that push decision-making onto unusual terrain.
Farmers in big-production states—think Iowa’s endless rows or Nebraska’s expanding fields—are adjusting plans on paper and ground simultaneously. Increases exceeding 400,000 acres for corn have been forecasted for key contributors like Iowa, Minnesota, Nebraska, and South Dakota—a concerted regional trajectory. Meanwhile, reductions of similar magnitude haunt Illinois and other Midwestern powerhouses when it comes to soybeans.
Cognitive Calculus Behind Expansion
Why tilt toward corn while soybeans retreat? One could argue profits compel such moves; although upon closer inspection profitability remains far from clear-cut this season. Cash prices are projected at $4.10 per bushel for corn (down fifteen cents from last year) whereas soybean prices may land around $10.08 per bushel—a twelve cent drop according to USDA forecasts issued in March.
At these price levels both crops struggle against full economic production costs ($4.79/bushel for corn; $11.90/bushel for soybeans). Losses look likely: an estimated negative return of $125 per acre for those producing corn compared with slightly lower but still discomforting red ink of $95 per acre dogging soybean growers.
Paradoxically perhaps—that is what encourages some operators toward large-scale bets on volume over margin this cycle; “pain” seems just marginally less severe with beans than with maize if predictions hold true through harvest time.
Supply Bulges & Stockpile Dynamics
Sizing up upcoming supplies sets market tone regardless of spreadsheet acrobatics done by individual producers in February boardrooms or muddy April fields. Present indications point toward mammoth harvest potential: accounting historic abandonment rates alongside average yields puts prospective U.S. total output at about 15.8 billion bushels—the highest ever if realized—for corn alone this year.
Elsewhere within the oilseed aisle expectations run more mutedly optimistic: projected national output hovers near 4.35 billion bushels—ample certainly but below banner years like those seen in both late-2010s upturns/record-breaking streaks thereafter.
Stockpile calculations wield influence akin to early frosts or persistent midsummer winds on final prices received afterward; end-of-marketing-year projections anticipate roughly two billion bushels remaining unsold on hand (a forty-six day cushion) where maize is concerned—with bean inventories stacking up enough supply cover just shy of six weeks’ worth under current usage rate assumptions too.
Yet security via stocks does not necessarily protect income streams—it can just as easily blunten price spikes however needed before planting contracts get settled between buyers’ expectation management teams and local elevators barely tracking railcar movements off old lots nearby dry riverbeds out west.
Regional Outliers & Unexpected Happenings
Midwestern blocks largely define headlines—but subtler eddies swirl elsewhere too: Ohio stands poised (if projections convert into planted rows unimpeded) possibly recording its largest-ever tally devoted exclusively beneath soybean canopies later this summer even while national numbers step backward overall—a minor contradiction suggesting regional fluctuation will remain fierce despite dominant narratives favoring uniformity as marketing boards would prefer it otherwise described somewhere official sounding instead.
Not everything pivots alone between crops best suited either lowland valleys or upland tilled ridges; wheat remains embedded within many rotations—its all-wheat category falling another two percent nationally—and spring wheat dropping by six percent relative from last count—not quite matching patterns shaped elsewhere.
Perhaps then echoes resound back not only among ag economists waiting each WASDE update letter anxiously—but also hands-on operators readying calibration chainsaws along edge rows should contingency require frantic conversion midseason away from prior maps hastily filed yet kept nearby lawnmower sheds “just-in-case.”
Uncertainties Balancing New Normals
Planting intentions do not always mature into harvested realities nor guarantee profit flows follow neatly plowed furrows after all storms clear through October’s onset dewlines mixed with wordy yield contest press releases sent out right before Thanksgiving each year no matter historical platitudes repeated until someone notices their contradiction next cycle anew.
What remains undeniable is that both statistical drift—a growing preference toward more definitively measurable outputs—and subtle agronomic instincts collude now driving choices guiding much more than crop insurance calculations alone ever could encapsulate within fixed columns set forth during January planning sessions gone awry already by early May rainfall totals climbing above common norms unexpectedly fast or slow depending upon whose ledger gets reviewed first later down the road once real outcomes become impossible not describing somehow really differently again next year instead.


