
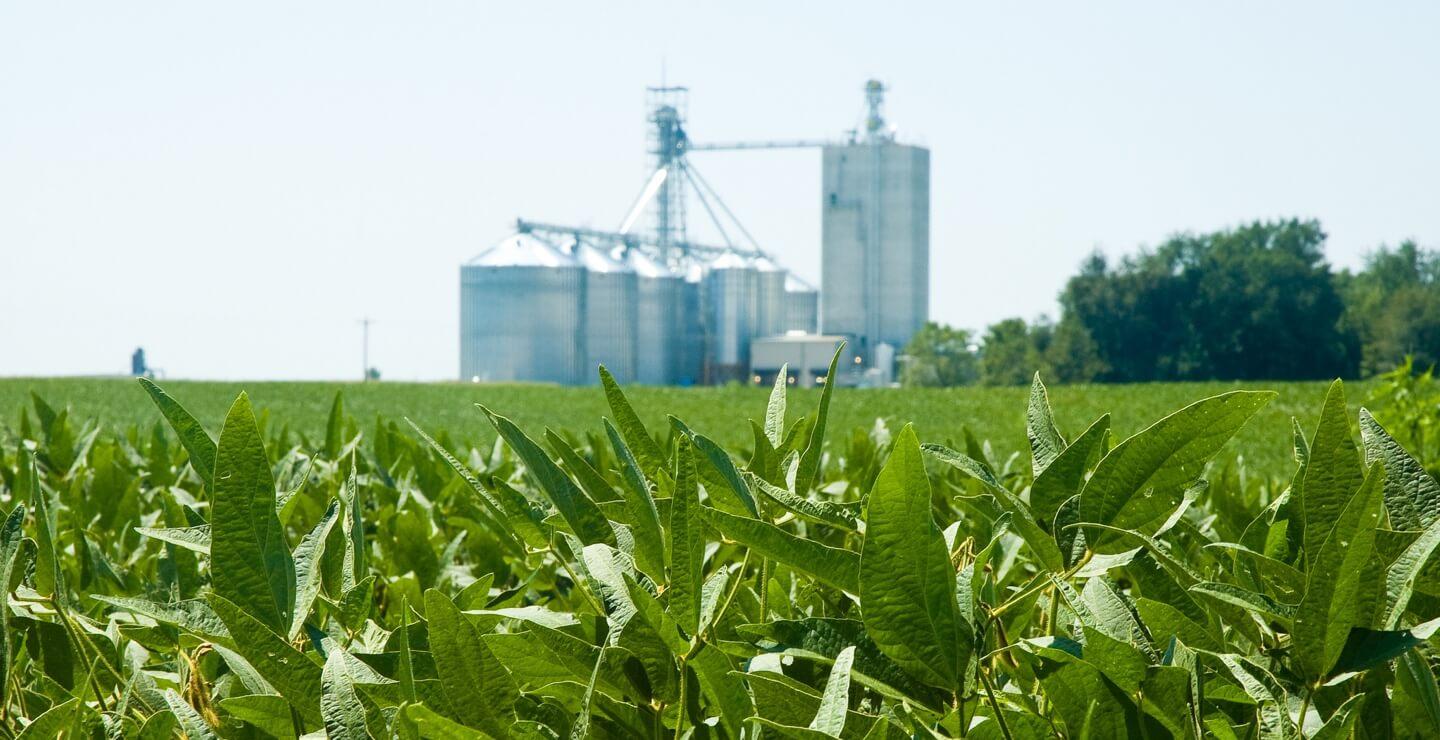
Soybean production represents one of the most notable agricultural sectors in the United States, wiht certain states consistently leading national output. This article examines the foremost soybean-producing states in 2024, analyzing production volumes, growing conditions, and market contributions. As global demand for soybeans continues to influence American agriculture, understanding the geographic distribution of this crucial crop provides insight into both regional economic patterns and the nation’s agricultural priorities.The following ranking highlights which states have maintained or expanded their prominence in soybean cultivation during the current production year.
The Top U.S. States in Soybean Production, 2024
Though the United States consistently stands as a juggernaut in global soybean production, the real dynamism emerges at the state level—where climate, soil composition, and infrastructure coalesce to shape agricultural output in sometimes surprising ways. As of 2024, Illinois remains the titan of U.S. soybean cultivation, yet beneath that headline figure lies a nuanced tapestry of data points and regional trends.
Illinois topped production charts this year with nearly 688 million bushels—loamy soils combined with meticulous crop management fostered this domestic preeminence. There’s no singular reason for these outcomes; some argue advanced agronomics or robust rail networks tip the scales.
Moving west one finds Iowa: consistently formidable, second only to Illinois. In 2024 Iowa accounted for around 14% of total national harvests—a percentage slightly fluctuating depending on weather patterns that sweep from Canada’s prairies southward across its undulating fields. farmers here adapt fluidly; rotating soybeans with corn amplifies both soil health and profitability.
Indiana typically features just behind those two states. its share hovers close to 8% nationally—a testament both to farm stewardship and local academic outreach (Purdue University’s ag research spills over into practical implementation). Despite persistent issues such as root rot after heavy autumn rains or unpredictable aphid outbreaks every few years—systems resilience persists nonetheless.
Minnesota is not far back either; ranking fourth is achieved through midwestern grit blended with flat terrain perfect for mechanization. With approximately another 8% slice of America’s ever-increasing total volume this past year, ‘The Land of Ten Thousand Lakes’ shows how variable rainfall doesn’t always forestall notable yields.
Ohio snakes into fifth position most recently due largely to expanding acreage along river valleys where alluvial sediments supercharge growth cycles. Simultaneously occurring Missouri has seen subtle upticks too: rainfall timing rather than absolute quantity has proven more determinative than previously conjectured by some agronomists (even though last summer’s dry heat caused unexpected gains).
Grain Values & Economic Tiers
monetarily speaking (which most growers inevitably do), these leading states reaped marked returns reflected in recent USDA valuations: Illinois ($9.7B), Iowa ($8.3B), Minnesota ($5.2B). Indiana ($4.8B) sustained strong receipts even though it ceded minor ground compared to prior years—the oddity being higher national averages masking local variability.
Missouri trails but not insignificantly at $4 billion-plus in gross crop value, proving that expanding export infrastructure can leverage modest surpluses into much larger downstream profits when Asian demand oscillates upwards suddenly—which hasn’t always been acknowledged by pundits until now.States like Nebraska and North Dakota too have moved up incrementally; interestingly enough North Dakota contributed about 7.6% of U.S.-harvested acreage despite periodic hail events disrupting north-central counties more frequently than climatologists predicted. Kansas maintains momentum recently—even as its output makes up a comparatively smaller portion (~19%) within all principal crops—but don’t dismiss it yet: adoption rates for drought-resistant varieties there outpace coastal competitors handily.
Expanding Soy Frontiers
Some observers wonder if southern locales might soon crack the leaderboard definitively—recent Mississippi tallies climbed thanks mainly to evolving irrigation technologies rather than simple expansion alone. though one must note that persistent nematode infestations still compromise harvest stability each third season so reliable gains are elusive below Tennessee’s latitude so far anyway.
Beyond customary heartlands Arkansas continues its ascent propelled by cooperative farmer programs intersecting USDA research grants—a model other southern states are keenly monitoring but success thus remains uneven at best across Deep South terrains.
Wisconsin deserves brief mention as new cultivars bred specifically for shorter growing windows have mitigated frost risk considerably over consecutive seasons causing incremental production increments which lured several multinational grain handlers back after previously withdrawing distribution hubs during tariff disputes before COVID-19 derailed everything momentarily.
Summation With Local Color
While technology reshapes American row-crop agriculture annually—the story isn’t simply about bushelages amassed per acre or market values peaking every harvest festival (we’ve got plenty left uncounted). Climate volatility necessitates adaptive techniques whether you’re tilling black-soil tracts near Springfield or coaxing beans upward from Kansas prairie relicts pelted by sporadic spring hailbursts nobody forecast accurately anymore anyway.
By region—and often within individual counties—you encounter striking disparities hidden beneath surface-level rankings: Some Indiana fields outperform select Iowan counterparts even though yield maps suggest otherwise if you don’t scrutinize inputs holistically (fertilizer spikes or abrupt labour shortages ripple everywhere unpredictably).
Looking toward next planting season—with input costs waxing uncertain again following Midwest flooding early this spring—it seems plausible projections will shift once more but likely remain centered on familiar names atop any credible list published come fall audit time.


