Declining Yield Variability and the 2025 U.S. Corn and Soybean Yield Distribution
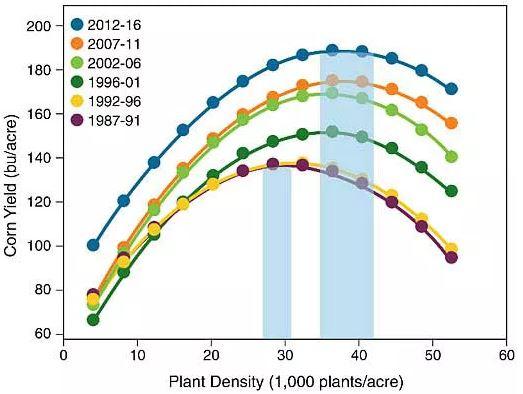
The world of row crops rarely sits still, but if you look closely at recent trends, something fascinating is afoot in American corn and soybean fields as 2025 approaches—a swift decline in yield variability. Once upon a time, sizable swings from year to year kept farmers up at night with visions of bumper crops or the specter of drought-induced disappointment. Now, the pendulum isn’t swinging quite as far.
Take corn as a living example: over recent decades, percent deviations from trend yield have shrunk notably. For 2025 harvests specifically, projections suggest yields could range from about 142 to 205 bushels per acre for corn—far less wild than earlier eras would permit. Similarly, soybeans present a spread between roughly 43 and 57 bushels per acre. These ribbons don’t flutter so much on stormy economic winds now; instead they hold steady underpinned by advances that percolate through genetics, field management quirks (think variable rate seeding or oddly timed cover crop termination), and perhaps less publicized—digital record-keeping that occasionally reminds us coffee breaks aren’t what they once were.
Corn Plantings Surge While Soybean Acres Contract
March’s USDA pronouncement added an unexpected dash of spice: U.S. growers intend to plant approximately 95.3 million acres in corn this year—that’s up nearly five percent versus last season. It’s significantly more ground given over to maize ambitions compared with beans.
As farmers pivot toward more green rows of corn waving in June sunlight than soybeans soaking up late July heat haze, implications ripple outward—to market expectations pressured by inventory recalculations or logistics planners raising eyebrows at rail schedules suddenly favoring one commodity above another.
Yield Ratios Still Matter (But They’re Changing Socks)
Peel back another layer; you’ll find experts aren’t just counting total bushels but also re-examining ratios between these cousin crops across midwestern states. In calendar year 2024—the last completed season—U.S. averages sat at about 179 bushels for corn and just north of fifty for soybeans (to be exact: near enough to seem planned).
That ratio shifts only slightly heading into this harvest cycle—but those subtle movements can spark animated coffee shop conversations among agronomists weighing nitrogen application against seed prices one week before planting windows slam shut unexpectedly due to April sleet squalls no model had predicted right anyway.
Soybean Yields Up… But Stocks Falling
Recent government estimates peg the average nationwide soybean yield for ’25 somewhere around a healthy-sounding mark: roughly fifty-two-and-a-half bushels per acre—a modest bump upward from last year’s tally. Despite better yields on average though? Total domestic production dips marginally thanks mostly to shrunken acreage commitments.
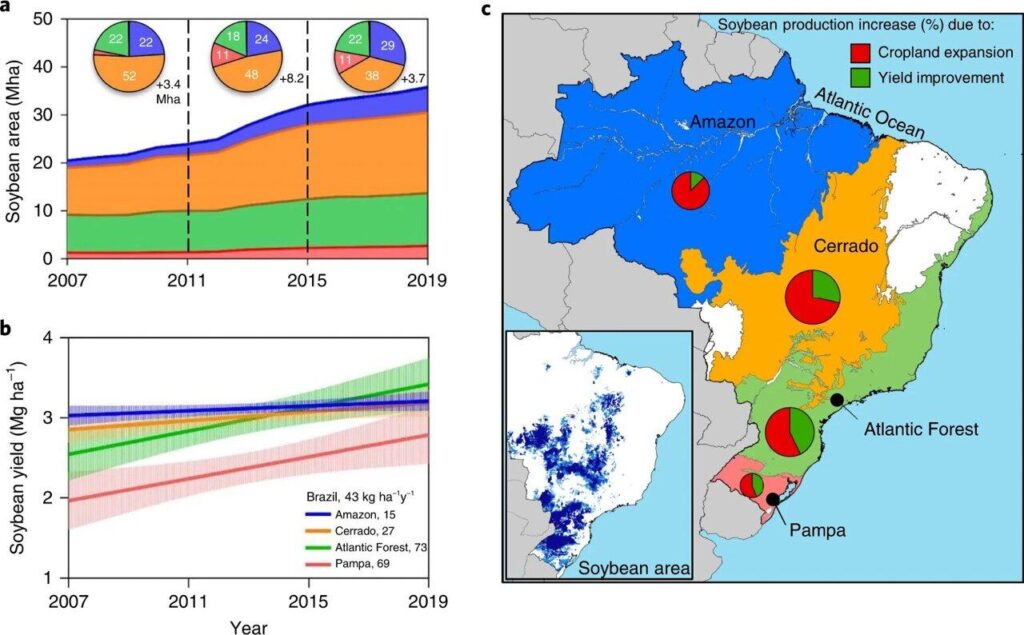
Ending stocks shrink even more dramatically—USDA has dialed down its expectations here too, pegging reserves fully sixteen percent lower than prior seasons’ finish lines. With crushing demand climbing (by an estimated seventy million extra beans finding their fate inside processors), exports paradoxically stumble by thirty-five million despite global production continuing its upward shuffle led by Brazilian expansionism rivaling Carnival parades without any confetti shortages detected yet.
What does all that mean on paper? Farm-level bean prices inch up again—not feverishly so but driven largely by basic arithmetic pinching supply against robust domestic usage while overseas surpluses buffer some volatility elsewhere along this convoluted trade chain highway littered with unfamiliar signs written partly in Portuguese these days.
Global Signals Or Just Local Noise?
Drifting briefly away from spreadsheets: Some market-watchers muse about whether shrinking variability represents ag engineering victory laps—or merely camouflaged climate patterns holding steady until next El Niño sneaks through Midwest farm gates without anyone remembering where their old windbreak maps went after all those digital upgrades happened two winters ago during ice storms nobody now discusses out loud anymore.
Brazil looms ever-larger; USDA expects record-shattering numbers southward soon enough—and Argentina hums quietly along just under previous highs despite local hiccups. If U.S distribution curves have narrowed already courtesy biotech know-how sprinkled atop drone-guided irrigation pivots then South American competitors must surely be packing their own set of surprises into upcoming seasons too?
Odd Angles Lost Somewhere Between Rows
To circle back around bumpy country lanes not always marked “Yield Ahead”: declining risk may bring relief—but it doesn’t guarantee predictably tidy paychecks come October weigh-ins either; memories linger long among rural co-ops whenever black swans—or stray combines careening absentmindedly toward muddy ruts—shift outcomes outside models’ best guesses painted cleanly across powerpoints churned out faraway boardrooms each springtime harbinger feels especially cold.
So while historical yield extremes appear tamed lately—with tech mixing freely into weather-watched tradition—the story is never finished either way; tomorrow’s charts might still splatter ink unpredictably like Pablo Picasso testing new brushes somewhere off-season if only because that’s how real stories often wander off script right before supper calls everyone home again under Gold Medal skies fading pink behind grain elevators older than half our best algorithms could ever politely guess.